Legend to the abbreviations in the Basketball tables: T = Tournaments participated in GP = Games played W = Games won L = Games lost PF = Game points for (i.e. points scored) PA = Game points against (points conceded) PD = Point difference P = Points (2 for a win and 1 for a loss) % = Winning percentage PFPG = Points for per game PAPG = Points against per game.
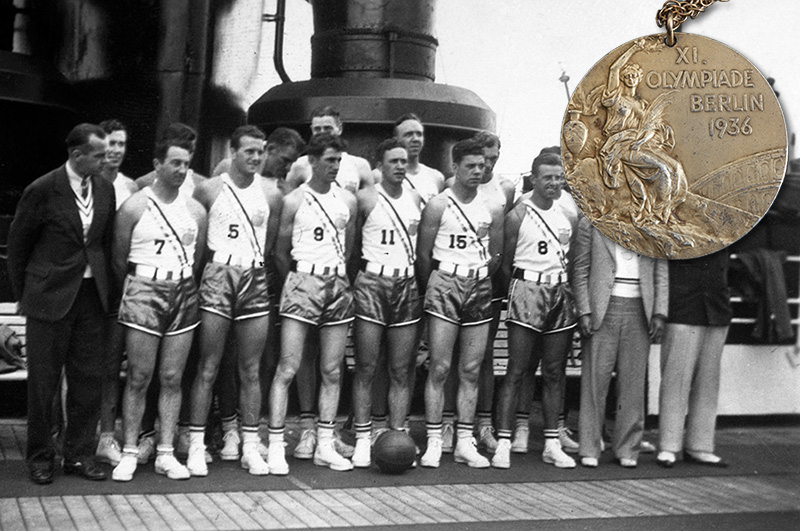
The Olympic champions 1936. The United States. (Source: http://www.sportscollectorsdigest.com/1936-basketball-olympic-gold-medal-offered-by-scp-auctions/)
Basketball became a member of the Olympic family in 1936, but it had been a demonstration sport as early as 1904 in St Louis. The amateur tournament – there were four separate basketball tournaments held – was won by Buffalo German YMCA. 32 years later the Americans won the gold after having beaten Canada in the final 19-8. Nowadays, 19-8 may be a score after the 1st quarter in a college game, but the teams can perhaps be excused by the fact that the final – as the whole tournament – was played outdoors. And to make matters worse, the skies of Berlin really opened that day! The rain was pouring down, leaving the players soaked. USA have won all the Olympic gold medals for men except for 1972 (the (in)famous game vs. USSR), 1980 (the boycott) and 1988 (when they “only” managed a bronze).
| Men Alltime Table Olympic Games 1936-2021 | ||||||||||||
| RANK | TEAM | T | GP | W | L | PF | PA | PD | P | % | PFPG | PAPG |
| 1 | United States | 19 | 148 | 142 | 6 | 13425 | 9208 | 4217 | 290 | 95,95 % | 90,7 | 62,2 |
| 2 | Soviet Union | 10 | 82 | 66 | 16 | 6805 | 5577 | 1228 | 148 | 80,49 % | 83,0 | 68,0 |
| 3 | Yugoslavia | 11 | 87 | 63 | 24 | 7171 | 6418 | 753 | 150 | 72,41 % | 82,4 | 73,8 |
| 4 | Slovenia | 1 | 6 | 4 | 2 | 605 | 535 | 70 | 10 | 66,67 % | 100,8 | 89,2 |
| 5 | Lithuania | 7 | 52 | 32 | 20 | 4392 | 4182 | 210 | 84 | 61,54 % | 84,5 | 80,4 |
| 6 | Italy | 12 | 94 | 55 | 39 | 6630 | 6373 | 257 | 149 | 58,51 % | 70,5 | 67,8 |
| 7 | Brazil | 15 | 111 | 64 | 47 | 8480 | 8010 | 470 | 175 | 57,66 % | 76,4 | 72,2 |
| 8 | Croatia | 4 | 28 | 16 | 12 | 2288 | 2225 | 63 | 44 | 57,14 % | 81,7 | 79,5 |
| 9 | Argentina | 8 | 56 | 32 | 24 | 4323 | 4176 | 147 | 88 | 57,14 % | 77,2 | 74,6 |
| 10 | Spain | 13 | 98 | 55 | 43 | 7978 | 7810 | 168 | 153 | 56,12 % | 81,4 | 79,7 |
| 11 | France | 10 | 66 | 36 | 30 | 4661 | 4442 | 219 | 102 | 54,55 % | 70,6 | 67,3 |
| 12 | Greece | 4 | 24 | 13 | 11 | 1841 | 1778 | 63 | 37 | 54,17 % | 76,7 | 74,1 |
| 13 | Mexico | 7 | 50 | 27 | 23 | 3071 | 2943 | 128 | 77 | 54,00 % | 61,4 | 58,9 |
| 14 | Canada | 9 | 66 | 35 | 31 | 4632 | 4455 | 177 | 101 | 53,03 % | 70,2 | 67,5 |
| 15 | Australia | 15 | 111 | 57 | 54 | 8960 | 8897 | 63 | 168 | 51,35 % | 80,7 | 80,2 |
| 16 | Uruguay | 7 | 55 | 28 | 27 | 3397 | 3573 | -176 | 83 | 50,91 % | 61,8 | 65,0 |
| 17 | Serbia | 1 | 8 | 4 | 4 | 667 | 627 | 40 | 12 | 50,00 % | 83,4 | 78,4 |
| 18 | Russia | 3 | 20 | 10 | 10 | 1530 | 1482 | 48 | 30 | 50,00 % | 76,5 | 74,1 |
| 19 | Hungary | 4 | 28 | 14 | 14 | 1596 | 1652 | -56 | 42 | 50,00 % | 57,0 | 59,0 |
| 20 | Cuba | 6 | 45 | 22 | 23 | 3254 | 3066 | 188 | 67 | 48,89 % | 72,3 | 68,1 |
| 21 | Czechoslovakia | 7 | 45 | 22 | 23 | 2995 | 2865 | 130 | 67 | 48,89 % | 66,6 | 63,7 |
| 22 | Philippines | 7 | 52 | 25 | 27 | 3166 | 3458 | -292 | 77 | 48,08 % | 60,9 | 66,5 |
| 23 | Peru | 3 | 19 | 9 | 10 | 973 | 949 | 24 | 28 | 47,37 % | 51,2 | 49,9 |
| 24 | Puerto Rico | 9 | 72 | 34 | 38 | 5480 | 5579 | -99 | 106 | 47,22 % | 76,1 | 77,5 |
| 25 | Chile | 4 | 26 | 12 | 14 | 1400 | 1388 | 12 | 38 | 46,15 % | 53,8 | 53,4 |
| 26 | Poland | 6 | 48 | 22 | 26 | 3253 | 3328 | -75 | 70 | 45,83 % | 67,8 | 69,3 |
| 27 | Bulgaria | 4 | 35 | 16 | 19 | 1955 | 2008 | -53 | 51 | 45,71 % | 55,9 | 57,4 |
| 28 | Sweden | 1 | 7 | 3 | 4 | 511 | 504 | 7 | 10 | 42,86 % | 73,0 | 72,0 |
| 29 | Belgium | 3 | 12 | 5 | 7 | 504 | 463 | 41 | 17 | 41,67 % | 42,0 | 38,6 |
| 30 | Latvia | 1 | 3 | 1 | 2 | 66 | 79 | -13 | 4 | 33,33 % | 22,0 | 26,3 |
| 31 | Estonia | 1 | 3 | 1 | 2 | 84 | 120 | -36 | 4 | 33,33 % | 28,0 | 40,0 |
| 32 | Czech Republic | 1 | 3 | 1 | 2 | 245 | 294 | -49 | 4 | 33,33 % | 81,7 | 98,0 |
| 33 | Finland | 2 | 12 | 4 | 8 | 674 | 779 | -105 | 16 | 33,33 % | 56,2 | 64,9 |
| 34 | China | 12 | 78 | 23 | 55 | 5311 | 6360 | -1049 | 101 | 29,49 % | 68,1 | 81,5 |
| 35 | Central African Republic | 1 | 7 | 2 | 5 | 490 | 582 | -92 | 9 | 28,57 % | 70,0 | 83,1 |
| 36 | Singapore | 1 | 7 | 2 | 5 | 446 | 551 | -105 | 9 | 28,57 % | 63,7 | 78,7 |
| 37 | Japan | 7 | 46 | 13 | 33 | 2846 | 3526 | -680 | 59 | 28,26 % | 61,9 | 76,7 |
| 38 | Germany | 6 | 37 | 10 | 27 | 2545 | 2877 | -332 | 47 | 27,03 % | 68,8 | 77,8 |
| 39 | Switzerland | 2 | 12 | 3 | 9 | 375 | 508 | -133 | 15 | 25,00 % | 31,3 | 42,3 |
| 40 | Venezuela | 2 | 12 | 3 | 9 | 888 | 1063 | -175 | 15 | 25,00 % | 74,0 | 88,6 |
| 41 | Panama | 1 | 9 | 2 | 7 | 739 | 798 | -59 | 11 | 22,22 % | 82,1 | 88,7 |
| 42 | South Korea | 6 | 47 | 8 | 39 | 3129 | 3686 | -557 | 55 | 17,02 % | 66,6 | 78,4 |
| 43 | Iran | 1 | 6 | 1 | 5 | 197 | 366 | -169 | 7 | 16,67 % | 32,8 | 61,0 |
| 44 | New Zealand | 2 | 12 | 2 | 10 | 856 | 987 | -131 | 14 | 16,67 % | 71,3 | 82,3 |
| 45 | Nigeria | 3 | 13 | 2 | 11 | 958 | 1160 | -202 | 15 | 15,38 % | 73,7 | 89,2 |
| 46 | Great Britain | 2 | 13 | 2 | 11 | 572 | 828 | -256 | 15 | 15,38 % | 44,0 | 63,7 |
| 47 | Egypt | 7 | 47 | 6 | 41 | 2170 | 2975 | -805 | 53 | 12,77 % | 46,2 | 63,3 |
| 48 | Senegal | 3 | 25 | 3 | 22 | 1435 | 1929 | -494 | 28 | 12,00 % | 57,4 | 77,2 |
| 49 | Angola | 5 | 31 | 3 | 28 | 1991 | 2518 | -527 | 34 | 9,68 % | 64,2 | 81,2 |
| 50 | Israel | 1 | 2 | 0 | 2 | 99 | 111 | -12 | 2 | 0,00 % | 49,5 | 55,5 |
| 51 | Romania | 1 | 2 | 0 | 2 | 90 | 125 | -35 | 2 | 0,00 % | 45,0 | 62,5 |
| 52 | Turkey | 2 | 4 | 0 | 4 | 121 | 176 | -55 | 4 | 0,00 % | 30,3 | 44,0 |
| 53 | Tunisia | 1 | 5 | 0 | 5 | 320 | 411 | -91 | 5 | 0,00 % | 64,0 | 82,2 |
| 54 | Ireland | 1 | 6 | 0 | 6 | 103 | 382 | -279 | 6 | 0,00 % | 17,2 | 63,7 |
| 55 | Iraq | 1 | 6 | 0 | 6 | 141 | 622 | -481 | 6 | 0,00 % | 23,5 | 103,7 |
| 56 | Thailand | 1 | 7 | 0 | 7 | 320 | 501 | -181 | 7 | 0,00 % | 45,7 | 71,6 |
| 57 | India | 1 | 7 | 0 | 7 | 458 | 797 | -339 | 7 | 0,00 % | 65,4 | 113,9 |
| 58 | Iran | 2 | 8 | 0 | 8 | 529 | 747 | -218 | 8 | 0,00 % | 66,1 | 93,4 |
| 59 | Morocco | 1 | 9 | 0 | 9 | 450 | 762 | -312 | 9 | 0,00 % | 50,0 | 84,7 |
| Women Alltime Table Olympic Games 1976-2021 | ||||||||||||
| RANK | TEAM | T | GP | W | L | PF | PA | PD | P | % | PFPG | PAPG |
| 1 | United States | 11 | 75 | 72 | 3 | 6814 | 4843 | 1971 | 147 | 96,00 % | 90,9 | 64,6 |
| 2 | Soviet Union | 4 | 21 | 18 | 3 | 1924 | 1439 | 485 | 39 | 85,71 % | 91,6 | 68,5 |
| 3 | Australia | 9 | 60 | 41 | 19 | 4393 | 3915 | 478 | 101 | 68,33 % | 73,2 | 65,3 |
| 4 | France | 4 | 29 | 19 | 10 | 2036 | 1969 | 67 | 48 | 65,52 % | 70,2 | 67,9 |
| 5 | Russia | 5 | 39 | 25 | 14 | 2822 | 2614 | 208 | 64 | 64,10 % | 72,4 | 67,0 |
| 6 | Spain | 5 | 30 | 19 | 11 | 2142 | 2086 | 56 | 49 | 63,33 % | 71,4 | 69,5 |
| 7 | Bulgaria | 3 | 16 | 10 | 6 | 1278 | 1279 | -1 | 26 | 62,50 % | 79,9 | 79,9 |
| 8 | Turkey | 2 | 12 | 7 | 5 | 792 | 771 | 21 | 19 | 58,33 % | 66,0 | 64,3 |
| 9 | Belgium | 1 | 4 | 2 | 2 | 319 | 282 | 37 | 6 | 50,00 % | 79,8 | 70,5 |
| 10 | Ukraine | 1 | 8 | 4 | 4 | 529 | 555 | -26 | 12 | 50,00 % | 66,1 | 69,4 |
| 11 | Serbia | 2 | 14 | 7 | 7 | 1001 | 1062 | -61 | 21 | 50,00 % | 71,5 | 75,9 |
| 12 | Yugoslavia | 3 | 16 | 8 | 8 | 1043 | 1120 | -77 | 24 | 50,00 % | 65,2 | 70,0 |
| 13 | China | 9 | 52 | 25 | 27 | 3763 | 3899 | -136 | 77 | 48,08 % | 72,4 | 75,0 |
| 14 | Brazil | 7 | 44 | 19 | 25 | 3275 | 3200 | 75 | 63 | 43,18 % | 74,4 | 72,7 |
| 15 | Slovakia | 1 | 7 | 3 | 4 | 401 | 407 | -6 | 10 | 42,86 % | 57,3 | 58,1 |
| 16 | Poland | 1 | 7 | 3 | 4 | 432 | 479 | -47 | 10 | 42,86 % | 61,7 | 68,4 |
| 17 | Greece | 1 | 7 | 3 | 4 | 512 | 577 | -65 | 10 | 42,86 % | 73,1 | 82,4 |
| 18 | Czech Republic | 3 | 19 | 8 | 11 | 1342 | 1351 | -9 | 27 | 42,11 % | 70,6 | 71,1 |
| 19 | Japan | 5 | 31 | 13 | 18 | 2400 | 2593 | -193 | 44 | 41,94 % | 77,4 | 83,6 |
| 20 | Cuba | 4 | 24 | 9 | 15 | 1707 | 1885 | -178 | 33 | 37,50 % | 71,1 | 78,5 |
| 21 | South Korea | 7 | 41 | 15 | 26 | 2811 | 3033 | -222 | 56 | 36,59 % | 68,6 | 74,0 |
| 22 | Hungary | 1 | 6 | 2 | 4 | 409 | 475 | -66 | 8 | 33,33 % | 68,2 | 79,2 |
| 23 | Canada | 7 | 39 | 11 | 28 | 2494 | 2784 | -290 | 50 | 28,21 % | 63,9 | 71,4 |
| 24 | Belarus | 2 | 11 | 3 | 8 | 733 | 770 | -37 | 14 | 27,27 % | 66,6 | 70,0 |
| 25 | New Zealand | 3 | 18 | 4 | 14 | 1116 | 1522 | -406 | 22 | 22,22 % | 62,0 | 84,6 |
| 26 | Latvia | 1 | 5 | 1 | 4 | 334 | 387 | -53 | 6 | 20,00 % | 66,8 | 77,4 |
| 27 | Croatia | 1 | 5 | 1 | 4 | 324 | 379 | -55 | 6 | 20,00 % | 64,8 | 75,8 |
| 28 | Czechoslovakia | 3 | 15 | 3 | 12 | 1005 | 1104 | -99 | 18 | 20,00 % | 67,0 | 73,6 |
| 29 | Italy | 3 | 18 | 3 | 15 | 1180 | 1381 | -201 | 21 | 16,67 % | 65,6 | 76,7 |
| 30 | Nigeria | 2 | 9 | 1 | 8 | 620 | 756 | -136 | 10 | 11,11 % | 68,9 | 84,0 |
| 31 | Puerto Rico | 1 | 3 | 0 | 3 | 176 | 280 | -104 | 3 | 0,00 % | 58,7 | 93,3 |
| 32 | Great Britain | 1 | 5 | 0 | 5 | 327 | 372 | -45 | 5 | 0,00 % | 65,4 | 74,4 |
| 33 | Mali | 1 | 5 | 0 | 5 | 255 | 402 | -147 | 5 | 0,00 % | 51,0 | 80,4 |
| 34 | Angola | 1 | 5 | 0 | 5 | 243 | 395 | -152 | 5 | 0,00 % | 48,6 | 79,0 |
| 35 | DR Congo | 1 | 7 | 0 | 7 | 400 | 626 | -226 | 7 | 0,00 % | 57,1 | 89,4 |
| 36 | Senegal | 2 | 11 | 0 | 11 | 577 | 937 | -360 | 11 | 0,00 % | 52,5 | 85,2 |