Cricket Alltimetable Women World Cup 1973-2017
Note: Games that haven’t been played at all, for example because of a rain-out, are not counted at all.
RunsT = Runs taken, RunsL = Runs Lost, RunCoff = Runs Coefficient.
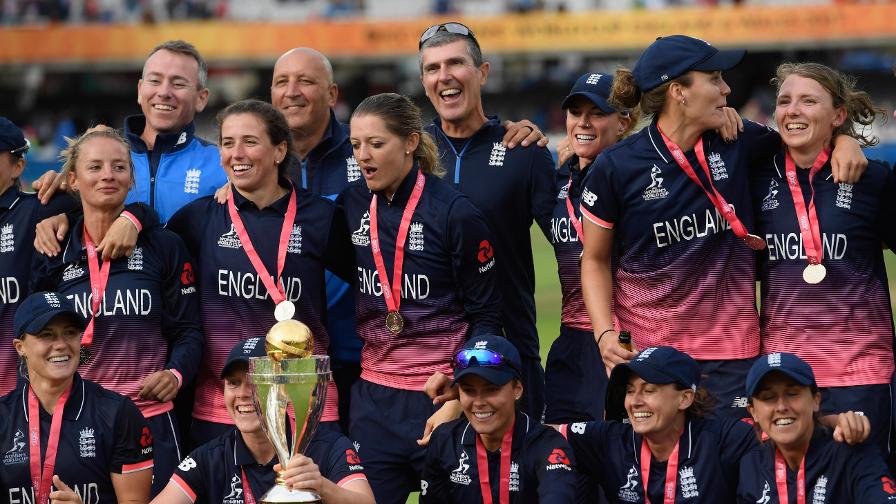
Australia may lead the alltimetable, but England is the reigning champions. (Source: ebc.co.uk).
| RANK | TEAM | T | GP | W | D | L | RunsT | RunsL | RunCoff | P | % |
| 1 | Australia | 11 | 81 | 69 | 1 | 11 | 14199 | 11020 | 1,29 | 139 | 85,80% |
| 2 | England | 11 | 81 | 57 | 2 | 22 | 15030 | 11944 | 1,26 | 116 | 71,60% |
| 3 | New Zealand | 11 | 78 | 49 | 2 | 27 | 12935 | 10715 | 1,21 | 100 | 64,10% |
| 4 | India | 9 | 61 | 34 | 1 | 26 | 9508 | 9048 | 1,05 | 69 | 56,56% |
| 5 | South Africa | 6 | 37 | 15 | 0 | 22 | 6006 | 6457 | 0,93 | 30 | 40,54% |
| 6 | West Indies | 6 | 37 | 13 | 0 | 24 | 5412 | 5701 | 0,95 | 26 | 35,14% |
| 7 | Sri Lanka | 6 | 34 | 8 | 0 | 26 | 4747 | 6024 | 0,79 | 16 | 23,53% |
| 8 | Ireland | 5 | 32 | 7 | 0 | 25 | 4217 | 4960 | 0,85 | 14 | 21,88% |
| 9 | International XI | 2 | 17 | 3 | 0 | 14 | 2023 | 3136 | 0,65 | 6 | 17,65% |
| 10 | Trinidad & Tobago | 1 | 6 | 2 | 0 | 4 | 548 | 688 | 0,80 | 4 | 33,33% |
| 11 | Pakistan | 4 | 23 | 2 | 0 | 21 | 2686 | 4464 | 0,60 | 4 | 8,70% |
| 12 | Netherlands | 4 | 25 | 2 | 0 | 23 | 2504 | 4213 | 0,59 | 4 | 8,00% |
| 13 | Denmark | 2 | 13 | 2 | 0 | 11 | 1244 | 2327 | 0,53 | 4 | 15,38% |
| 14 | Jamaica | 1 | 5 | 1 | 0 | 4 | 629 | 748 | 0,84 | 2 | 20,00% |
| 15 | England Youth | 1 | 6 | 1 | 0 | 5 | 589 | 832 | 0,71 | 2 | 16,67% |