CURLING OLYMPICS ALLTIMETABLES
Below are the male and female alltimetables for the Curling event at the Olympic games. Note that the 1928 and 1988 not are included as they were demonstration events at the time. SF = Stones for, SA = Stones against, SD = Stone difference, W% = Winning percentage, SFPGA = Stones for per game average.

The Swedish and British curling teams at the 1924 Olympics in stylish outfits. (Source: slate.com)
CURLING MEN ALLTIMETABLE OLYMPICS 1924, 1998-2018 |
||||||||||
| RANK | TEAM | T | GP | W | L | SF | SA | SD | W% | SFPGA |
| 1 | Canada | 6 | 64 | 50 | 14 | 476 | 303 | 173 | 78,13% | 7,44 |
| 2 | Finland | 2 | 20 | 13 | 7 | 113 | 107 | 6 | 65,00% | 5,65 |
| 3 | Norway | 6 | 59 | 37 | 22 | 375 | 323 | 52 | 62,71% | 6,36 |
| 4 | Switzerland | 6 | 61 | 36 | 25 | 378 | 316 | 62 | 59,02% | 6,20 |
| 5 | Sweden | 7 | 63 | 36 | 27 | 393 | 406 | -13 | 57,14% | 6,24 |
| 6 | Great Britain | 7 | 61 | 30 | 31 | 419 | 364 | 55 | 49,18% | 6,87 |
| 7 | China | 2 | 20 | 9 | 11 | 129 | 126 | 3 | 45,00% | 6,45 |
| 8 | South Korea | 1 | 9 | 4 | 5 | 65 | 63 | 2 | 44,44% | 7,22 |
| 9 | United States | 6 | 60 | 26 | 34 | 357 | 377 | -20 | 43,33% | 5,95 |
| 10 | Japan | 2 | 17 | 7 | 10 | 88 | 103 | -15 | 41,18% | 5,18 |
| 11 | Italy | 2 | 18 | 7 | 11 | 97 | 122 | -25 | 38,89% | 5,39 |
| 12 | Russia | 1 | 9 | 3 | 6 | 58 | 70 | -12 | 33,33% | 6,44 |
| 13 | Denmark | 4 | 36 | 11 | 25 | 202 | 263 | -61 | 30,56% | 5,61 |
| 14 | Germany | 5 | 43 | 13 | 30 | 250 | 305 | -55 | 30,23% | 5,81 |
| 15 | France | 3 | 20 | 3 | 17 | 80 | 193 | -113 | 15,00% | 4,00 |
| 16 | New Zealand | 1 | 9 | 0 | 9 | 37 | 76 | -39 | 0,00% | 4,11 |
 The Canadian gold medal team from Sochi 2014. (Source: pinterest.com).
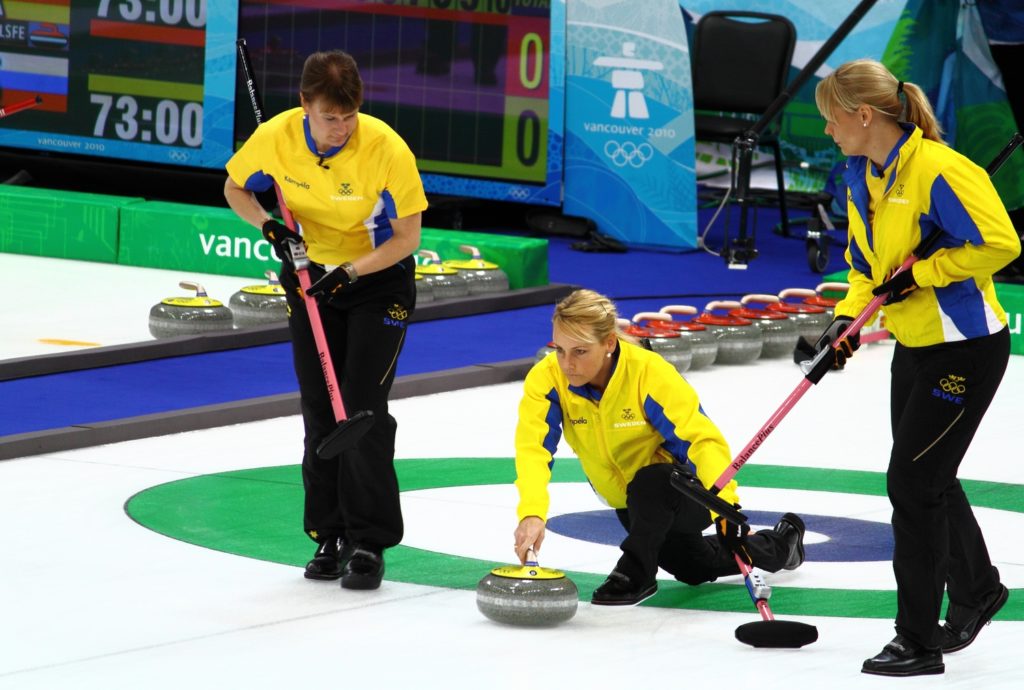 Three of the members of the Swedish gold medal team at the 2010 Olympics. (Source: wikipedia).
|
||||||||||||||||||||||||||||||||||||||||||||||||||||||||||||||||||||||||||||||||||||||||||||||||||||||||||||||||||||||||||||||||||||||||||||||||||||||||||||||||||||||||||||||||||||||||||||||||